Publications
Selected publications
2026
doi:10.1038/s41564-026-02458-5
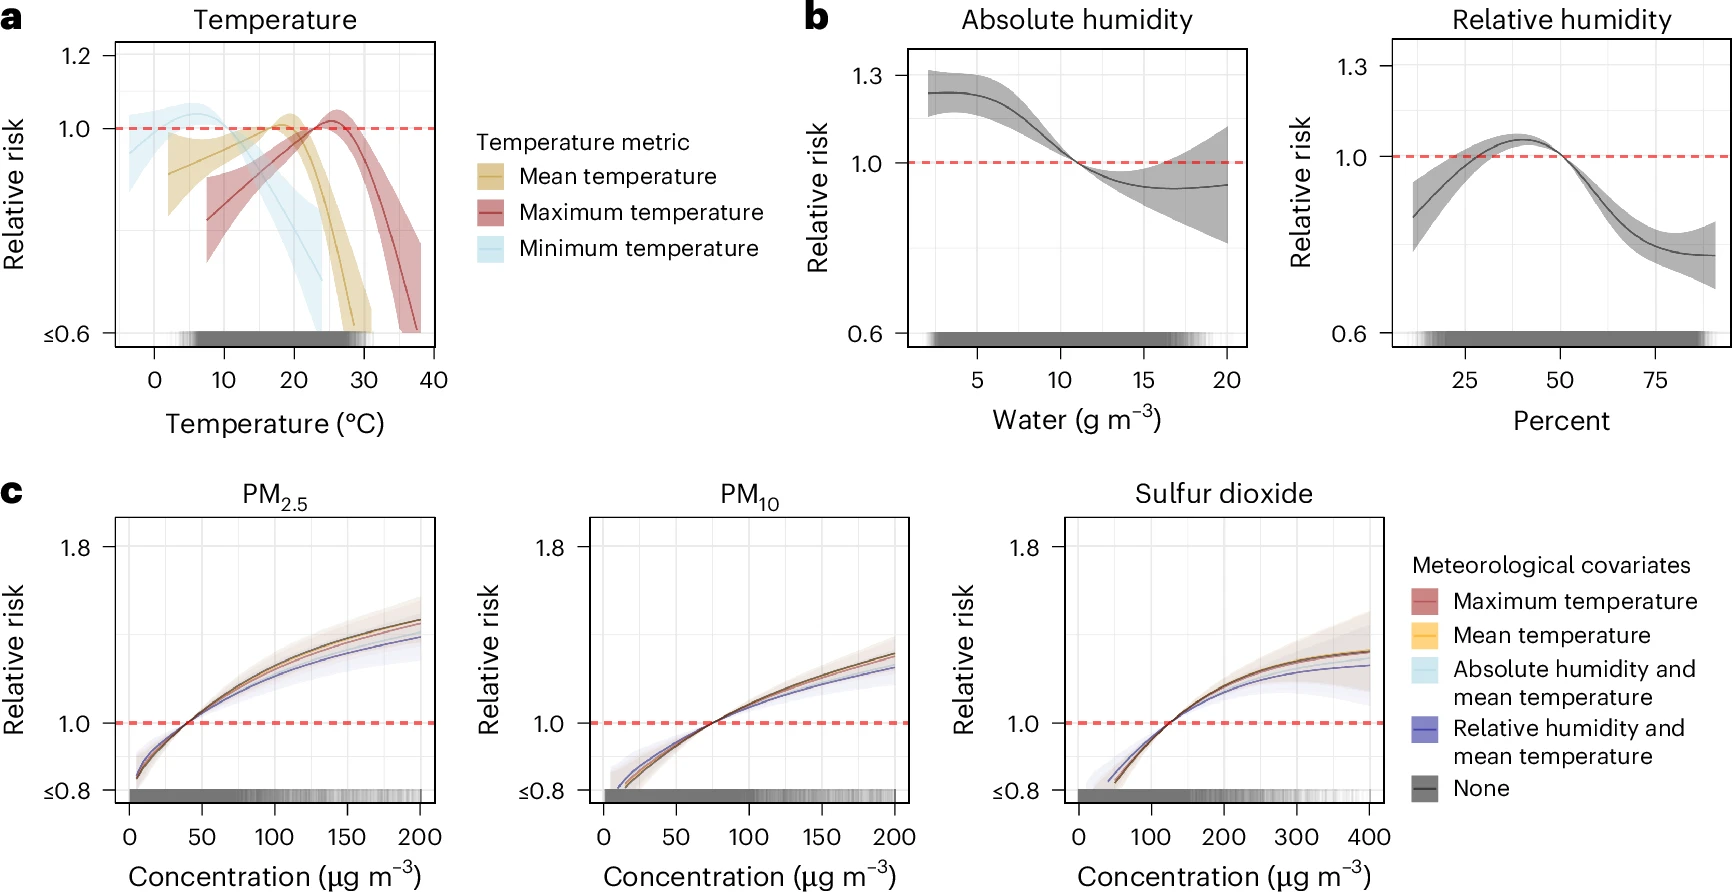
Figure 2. a,b, Meteorological models. a, Exposure–response curves for maximum (pink), mean (yellow) and minimum (blue) temperature in °C. b, Exposure–response curves for absolute humidity (g m−3) (left) and % relative humidity (right). c, Air pollution models. Exposure–response curves for PM2.5 (left) PM10 (middle) or sulfur dioxide (SO2) (right) including models with combinations of meteorological covariates (temperature metrics with linear formulations and humidity metrics with nonlinear formulations): maximum temperature (red), mean temperature (yellow), absolute humidity and mean temperature (light blue), relative humidity and mean temperature (dark blue), and none (black) with 3-week lags for humidity and no lag for temperature. These models were fitted to weekly district-level data from 2005 to 2019 across South Africa. The DLNM cross-basis for the humidity variables has 3 degrees of freedom, while the rest of the DLNMs have 2 degrees of freedom. At the bottom of a–c are rug plots with the distribution of the variables in the DLNM. In a, the rug plot is for mean temperature. Shading represents 95% credible intervals and points indicate the median. 2024
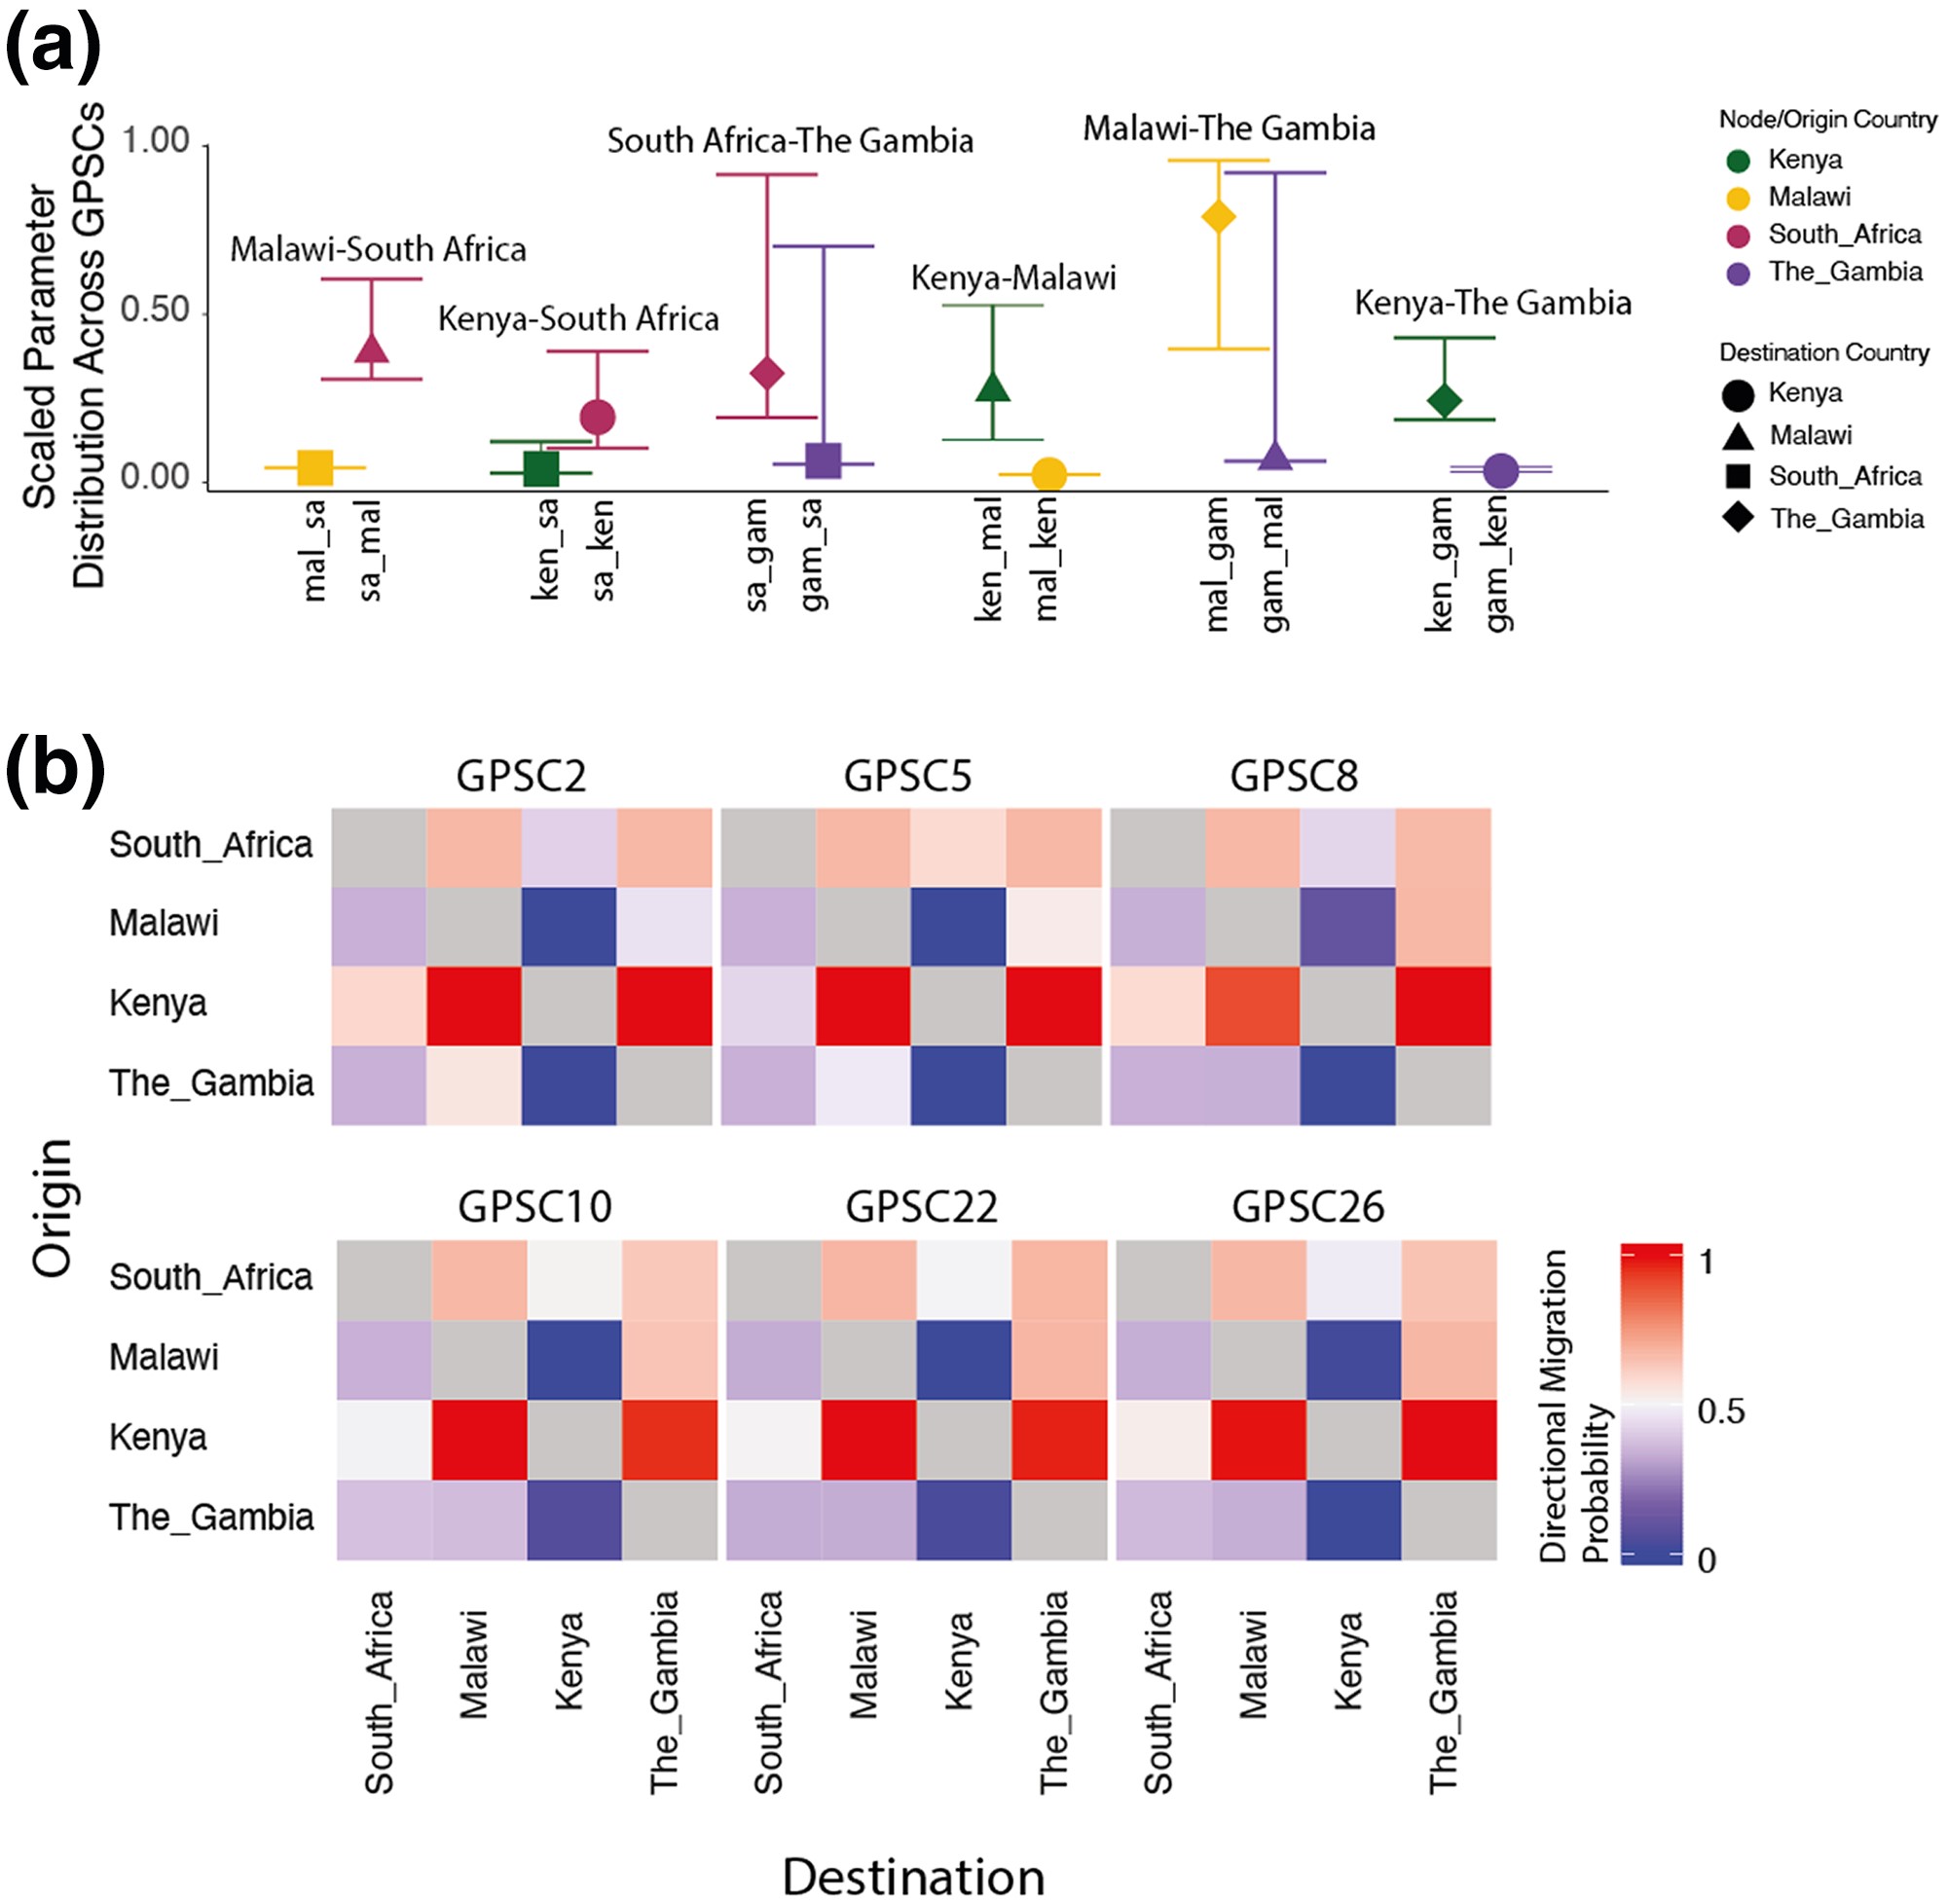
Figure 3a, b. Migration parameters summary estimates. a, The scaled distribution of migration probabilities for each deme across GPSCs grouped by deme pair and colored according to country of origin and shaped according to destination. b, Migration parameters directional probability estimates between each deme pair. Colored by the probability of migration between each deme pair. Where red is >50% migration probability and blue is <50% migration probability. 2024
doi:10.1038/s41586-024-07626-3
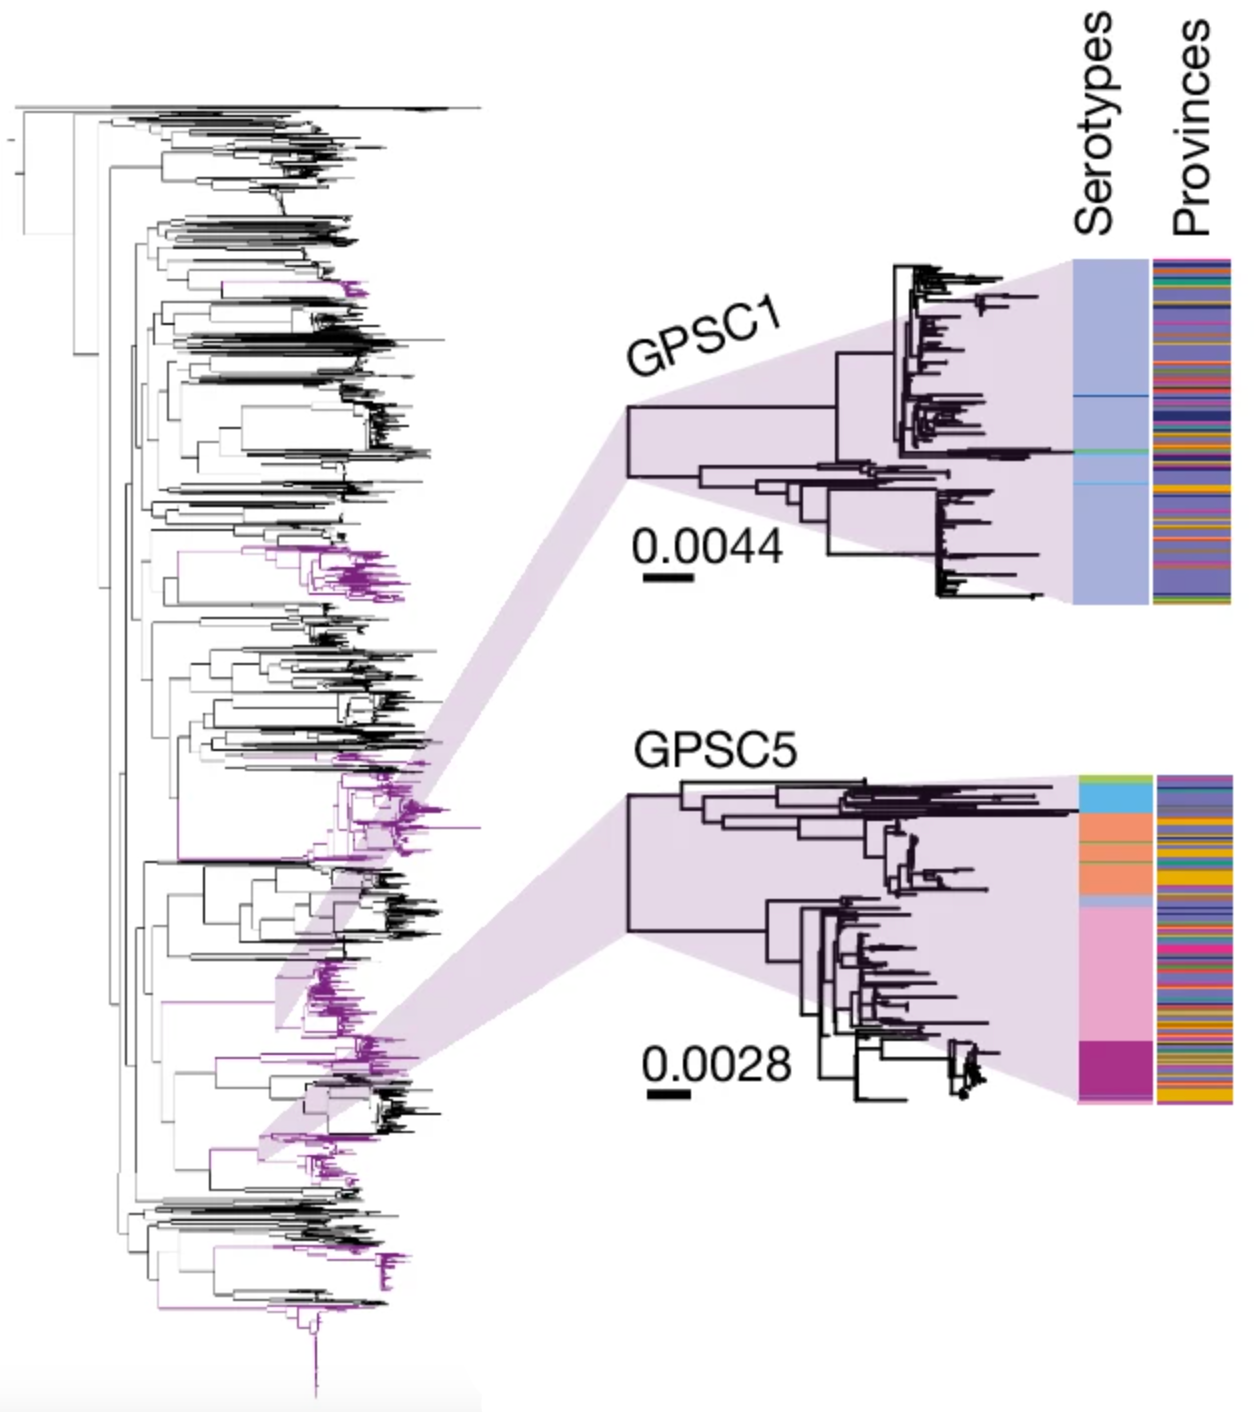
Figure 1a. Phylogenetic tree of 6,910 South African isolates included in this study. Dominant GPSCs (n > 50) are in purple. GPSC1 (top) and GPSC5 (bottom) are highlighted. The columns describe the serotypes and provincial region for each isolate. The branch length legends refer to single nucleotide polymorphisms (SNPs) per site and trees are midpoint rooted.
All publications
2026
2026
2026
2024
2024
2024
2023
2023
Geographic Migration and Evolution of Streptococcus pneumoniae2022
2022
2022
2021
2021
2020